Companies often split shares of their stock to try to make them more affordable to individual investors. A stock split does not dilute the ownership interests of existing shareholders. When a company declares a stock split, its share price will decrease, but a shareholder’s total market value will remain the same. For example, if you own 100 shares of a company that trades at $100 per share and the company declares a two for one stock split, you will own a total of 200 shares at $50 per share immediately after the split. If the company pays a dividend, your dividends paid per share will also fall proportionately.
A stock may split two for one, three for two, or any other combination.
A stock split is when a company creates more shares out of existing shares and in the process reduce its share price to make the shares more affordable to purchase by shareholders and investors.
The company’s overall value stays the same while dividing its existing shares into greater number of smaller, less expensive shares.
The stock split ratios for example a 2-for-1 split means every existing share (1) is divided by 2 resulting to 2 shares. So, if you own 10 shares worth $10.00 each before the split in this hypothetical example, after the 2-for-1 split, you will own 20 shares with each share worth $5.00 each.
REASON FOR STOCK SPLITS
A stock split makes the stock more affordable for more investors and thus can be used to draw in new investors who may have been reluctant or simply unable to purchase the stock at its higher price.
The move is a useful strategy when a company’s stock price rises to a level that prices many investors out, or when the price has risen significantly higher than its competitors’ stock.
Stock splits can be a lucrative and important step for companies looking to draw in more investors. This is particularly true for companies that are experiencing rapid growth. A company that is growing or believes it will grow may choose to split their stock, giving a positive indication of growth to investors and shareholders, which ultimately helps it grow.
Market value is the selling price of an asset or company on the open market, based on what buyers are willing to pay and what sellers are willing to accept.
What Is Market Value?
Market value is the price an asset would fetch in the market, based on the price that buyers are willing to pay and sellers are willing to accept. It may also refer to the market capitalization of a publicly traded company, calculated by multiplying the number of outstanding shares by the current share price.
Market value is easiest to determine for exchange-traded instruments such as stocks and futures, since their market prices are widely disseminated and easily available, but it is a little more challenging for over-the-counter instruments like fixed-income securities. It is also difficult to get an objective market value for illiquid assets like real estate and businesses, which may necessitate the use of real estate appraisers or business valuation experts.
Key Takeaways
Market value is the price of an asset on the marketplace, based on the prices buyers are willing to pay and what sellers are willing to accept.
For publicly traded companies, market value refers to the market capitalization: the number of outstanding shares times the share price.
For private businesses, market value can be estimated looking at metrics such as cash flow, earnings, growth prospects, assets, and liabilities as well as the selling prices of similar businesses.
It may be difficult to determine the market value for illiquid or non-fungible assets, like real estate or businesses.
Understanding Market Value
A company’s market value is a good indication of investors’ perceptions about its business prospects. The range of market values in the marketplace is enormous, ranging from less than $1 million for the smallest companies to hundreds of billions, and even trillions for the world’s biggest and most successful companies.
Market value is determined by the valuations or multiples accorded by investors to companies, such as price-to-sales, price-to-earnings, enterprise value-to-EBITDA, and so on. The higher the valuations, the greater the market value.
Preferred stock is a class of shares that give the holder a higher claim to dividends or asset distribution than common stockholders.
What Is Preferred Stock?
The term “stock” refers to ownership or equity in a firm. There are two types of equity: common stock and preferred stock. Preferred stockholders have a higher claim to dividends or asset distribution than common stockholders. The details of each preferred stock depend on the issue.
Key Takeaways
Preferred stock is a different type of equity that represents ownership of a company and the right to claim income from the company’s operations.
Preferred stockholders have a higher claim on distributions (e.g., dividends) than common stockholders.
Preferred stockholders usually have no or limited voting rights in corporate governance.1
In the event of a liquidation, preferred stockholders’ claim on assets is greater than common stockholders but less than bondholders.2
Preferred stock has characteristics of both bonds and common stock, which enhances its appeal to certain investors.
Understanding Preferred Stock
Preferred shareholders have priority over common stockholders when it comes to dividends, which generally yield more than common stock and can be paid monthly or quarterly.1
These dividends can be fixed or set in terms of a benchmark interest rate like the London Interbank Offered Rate (LIBOR), and are often quoted as a percentage in the issuing description.
Adjustable-rate shares specify certain factors that influence the dividend yield, and participating shares can pay additional dividends that are reckoned in terms of common stock dividends or the company’s profits. The decision to pay the dividend is at the discretion of a company’s board of directors.
Unlike common stockholders, preferred stockholders have limited rights, which usually does not include voting. Preferred stock combines features of debt, in that it pays fixed dividends, and equity, in that it has the potential to appreciate in price. This appeals to investors seeking stability in potential future cash flows.
A company’s book value is its shareholders’ equity found on its balance sheet, which is the result of its assets minus its liabilities.
What Is Book Value?
Book value is the value of a company’s assets after deducting its liabilities. It approximates the total value shareholders would receive if the company were liquidated. The book value is the sum of all of the line item amounts in the shareholders’ equity section on a company’s balance sheet. Investors can use this metric to help determine whether a company is under or overvalued.
Key Takeaways
A company’s book value is the sum of all the line items in the shareholders’ equity section of a balance sheet.
Book value is often different from a company’s market value.
Book value per share and the price-to-book ratio are utilized in fundamental analysis.
A book value per share that’s lower than the market price for the share may indicate that a stock is overvalued.
Understanding Book Value
The term book value refers to a company’s shareholders’ equity. This is the value of all of the company’s assets after its liabilities are deducted. As such, it represents the net worth of a company or how much it would be worth to shareholders if the company was liquidated.
While it may provide the basic framework of a company’s net worth, the book value isn’t necessarily accurate. That’s because it relies on historical information and doesn’t highlight the (true) value of any intangible assets like patents and trademarks. It’s also different from a company’s market value, which is the current value of the company. Market value is generally determined by investor sentiment and forward expectations.
Investors can find a company’s shareholders’ equity (along with the value of its assets and liabilities) on its balance sheet. The book value can help investors in two ways:
It is used in and with other financial ratios to help investors value a company.
When compared to the company’s market value, book value can indicate whether a stock is underpriced or overpriced.
Book value is also included in some financial ratios that can help investors size up a company’s financial health.
Important
There is also a book value used by accountants to value the assets owned by a company. This differs from the book value for investors because it is only used internally for managerial accounting purposes.
Book Value per Share (BVPS)
Book value per share (BVPS) is the per-share book value. Investors can calculate it easily if they have the balance sheet of a company of interest. Investors can compare BVPS to a stock’s market price to get an idea of whether that stock is overvalued or undervalued.
To get BVPS, divide the figure for total common shareholders’ equity by the total number of outstanding common shares. To obtain the figure for total common shareholders’ equity, take the figure for total shareholders’ equity and subtract any preferred stock value. If there is no preferred stock, then simply use the figure for total shareholder equity.
Example:
BVPS = Total Shareholder Equity – Preferred Stock ÷ Total Common Shares Outstanding
So, if a company had $21 million in shareholders’ equity (and no preferred stock) and two million outstanding common shares, its book value per share would be $10.50:
BVPS = $21 million ÷ 2 million
BVPS = $10.50
If the market price for a share is higher than the BVPS, then the stock may be seen as overvalued.
Fast Fact
There is a difference between outstanding and issued shares, but some companies might refer to outstanding common shares as issued shares in their reports.
Price-to-Book (P/B) Ratio
Price-to-book (P/B) ratio as a valuation multiple is useful when comparing similar companies within the same industry that follow a uniform accounting method for asset valuation. It can offer a view of how the market values a particular company’s stock and whether that value is comparable to the BVPS.
The ratio may not serve as a valid valuation basis when comparing companies from different sectors and industries because companies in other industries may record their assets differently. As a result, a high P/B ratio would not necessarily be a premium valuation, and conversely, a low P/B ratio would not automatically be a discount valuation when comparing companies in different industries.
Example:
The P/B ratio is simple to calculate. Just divide the market price per share by the book value per share.
P/B Ratio = Market Share Price ÷ Book Value Per Share
In the previous example, the BVPS was $10.50. So, if the company’s shares had a current market value of $13.17, its price-to-book ratio would be 1.25:
P/B Ratio = $13.17 ÷ $10.50
P/B Ratio = 1.25
The figure of 1.25 indicates that the market has priced shares at a premium to the book value of a share. Some may consider this to mean a stock is overvalued.
Examples of Book Value
Shareholders’ equity is a section on a company’s balance sheet that displays the shareholders’ claim on assets after liabilities have been accounted for. The image below is Amazon’s (AMZN) consolidated balance sheet for its 2024 fiscal year. Note the Liabilities and Stockholders’ Equity section, and in particular the stockholders’ equity details within the red outline.1
Notice the section marked Total Stockholders’ Equity with a value of $285.97 billion. That is Amazon’s book value. This figure is calculated by adding the values of preferred stock, common stock, Treasuries, additional paid-in capital, accumulated other comprehensive income (or loss), and retained earnings.
Some companies include in this section unrealized gains or losses, capital surplus or cumulative adjustments, and many other line items, depending on the industry a company operates in and its internal accounting procedures.
The following image shows Coca-Cola’s (KO) Equity Attributable to Shareowners line at the bottom of its Shareowners’ Equity section. In this case, that total of $24.86 billion would be the company’s book value. It’s one metric that an investor may look for if they’re interested in valuating Coca-Cola as a potential investment.2
Since a company’s book value represents net worth, comparing book value to the market value of the shares can serve as an effective valuation technique when trying to decide whether shares are fairly priced.
Why Is It Called “Book Value”?
The term book value is derived from accounting lingo, where the accounting journal and ledger are known as a company’s books. Another name for accounting is bookkeeping.
What Does a Price-to-Book Ratio of 1.0 Mean?
A P/B ratio of 1.0 indicates that the market price of a share of stock is exactly equal to its book value. For value investors, this may signal a good buy since the market price generally carries some premium over book value.
Why Is Market Value Often Higher Than Book Value?
Book value only uses a company’s total shareholder equity. It may not include intangible assets such as patents, intellectual property, brand value, and goodwill. It also may not fully account for workers’ skills, human capital, and future profits and growth. Therefore, the market value, which is determined by the market (sellers and buyers) and represents how much investors are willing to pay after accounting for all of these factors, will generally be higher.
The Bottom Line
Book value is the value of a company’s total assets minus its total liabilities. It is equal to total shareholders’ equity. A company’s market value will usually be greater than its book value because the market price incorporates investor’s thoughts and calculations about intangible assets, such as intellectual property, human capital, and future growth prospects. Value investors look for relatively low book values (using metrics like P/B ratio or BVPS) but otherwise strong fundamentals in their quest to find undervalued companies.
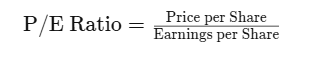
PE ratio is the ratio of a company’s stock price to its earnings per share. Value investors commonly use it as one way to measure if a company is undervalued.
Calculating the P/E Ratio
To calculate a company’s P/E ratio, we use the following formula:
COMPANY (Sample data)
STOCK PRICE (P/S)
Diluted EARNINGS PER SHARE (EPS)
PRICE-to-EARNINGS (P/E) Ratio
Company AA
106.94
6.31
106.94/6.31 = 16.95
Company BA
150.91
9.76
150.91/9.76 = 15.46
Company CA
79.95
3.71
79.95/3.71 = 21.55
Company DA
178.35
7.54
178.35/7.54 = 23.66
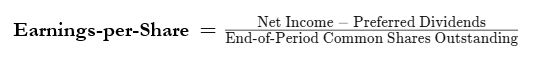
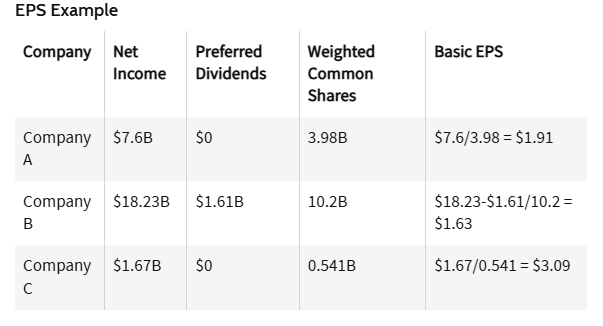
EARNINGS PER SHARE (EPS):
Earnings per share (EPS) is a company’s net income subtracted by preferred dividends and then divided by the number of common shares it has outstanding.
Calculating Earnings per Share:
Forward Price-to-Earnings (Forward P/E)
Forward price-to-earnings (forward P/E) is a version of the ratio of price-to-earnings (P/E) that uses forecasted earnings to calculate the ratio.
Calculating Forward P/E Ratio:
For example, assume a company has a current share price of $50 and this year’s earnings per share (EPS) are $5. Analysts estimate that the company’s earnings will grow by 10% over the next fiscal year. The company has a current P/E ratio of:
The forward P/E, on the other hand, would be $50 / (5 x 1.10) = 9.1x. Note that the forward P/E is smaller than the current P/E since the forward P/E accounts for future earnings growth relative to today’s share price.
Trailing Price-To-Earnings (Trailing P/E)
Trailing price-to-earnings (P/E) is a relative valuation multiple that is based on the last 12 months of actual earnings. It is calculated by taking the current stock price and dividing it by the trailing earnings per share (EPS) for the past 12 months.
Trailing P/E can be contrasted with the forward P/E, which instead uses projected future earnings to calculate the price-to-earnings ratio.
Calculating Trailing P/E Ratio:
Trailing P/E Ratio = Current Share Price / Trailing 12-Month EPS
Example of Trailing Price-To-Earnings
For example, a company with a stock price of $50 and 12 month trailing EPS of $2, thus has a trailing P/E ratio of 25x (read 25 times). This means that the company’s stock is trading at 25x its trailing 12 month earnings.
Using the same example, if the company’s stock price falls to $40 midway through the year, the new P/E ratio is 20x, which means the stock’s price is now trading at only 20x its earnings. Earnings have not changed, but the stock’s price has dropped.
The price/earnings-to-growth ratio, or PEG ratio, divides a company’s price-to-earnings (P/E) ratio by its earnings growth rate over a specific period. It strengthens the P/E ratio by taking into consideration the growth rate of earnings.
The PEG ratio is a stock valuation measure that investors and analysts can use to get a broad assessment of a company’s performance and to evaluate investment risk.
In theory, a PEG ratio value of 1 represents a perfect correlation between the company’s market value and its projected earnings growth. PEG ratios higher than 1.0 are generally considered unfavorable, suggesting a stock is overvalued. Conversely, ratios lower than 1.0 are considered better, indicating a stock is undervalued.
Key Takeaways
The price/earnings-to-growth, or PEG ratio is a valuation metric used for stocks.
PEG builds on the P/E ratio by considering expected earnings growth and not just current earnings.
A PEG ratio of under 1.0 can indicate a stock is undervalued and a potential buy.
A PEG above 1.0 can indicate an overvalued stock.
The PEG will vary based on earnings growth forecasts and the time frame being considered.
Calculating the PEG Ratio
To calculate a stock’s PEG ratio you must first figure out its P/E ratio. The P/E ratio is calculated by dividing the per-share market value by its per-share earnings. From here, the formula for the PEG ratio is simple:
Example of the PEG Ratio
If you’re choosing between two stocks from companies in the same industry, then you may want to look at their PEG ratios to make your decision. For example, the stock of Company Y may trade for a price that’s 15 times its earnings, while Company Z’s stock may trade for 18 times its earnings. If you simply look at the P/E ratio, then Company Y may seem like the more appealing option.
However, Company Y has a projected five-year earnings growth rate of 12% per year while Company Z’s earnings have a projected growth rate of 19% per year for the same period. Here’s what their PEG ratio calculations would look like:
Company Y PEG = 15/12% = 1.25
Company Z PEG = 18/19% = 0.95
This shows that when you take possible growth into account, Company Z could be the better option because it’s actually trading for a discount compared to its value.
Moving average convergence/divergence (MACD) is a technical indicator to help investors identify price trends, measure trend momentum, and identify entry points for buying or selling. Moving average convergence/divergence (MACD) is a trend-followingmomentum indicator that shows the relationship between two exponential moving averages (EMAs) of a security’s price. MACD was developed in the 1970s by Gerald Appel, and is one of the most popular technical tools, readily available on most trading platforms offered by online stock brokers.
Key Takeaways
Moving average convergence/divergence (MACD) is a technical indicator to help investors identify entry points for buying or selling.
The MACD line is calculated by subtracting the 26-period exponential moving average (EMA) from the 12-period EMA.
The signal line is a nine-period EMA of the MACD line.
MACD is best used with daily periods, where the traditional settings of 26/12/9 days is the default.
MACD Formula
MACD is calculated by subtracting the long-term EMA (26 periods) from the short-term EMA (12 periods). An EMA is a moving average (MA) that places a greater weight and significance on the most recent data points.
Using MACD
MACD has a positive value (shown as the blue line on the MACD chart) whenever the 12-period EMA (indicated by the red line on the price chart) is above the 26-period EMA (the blue line in the price chart), and a negative value when the 12-period EMA is below the 26-period EMA. The distance between MACD and its baseline depends on the distance between the two EMAs.


:max_bytes(150000):strip_icc():format(webp)/Screenshot2025-04-23at8.20.01AM-f39f63cf6bf442438b09fb0296305171.png)
:max_bytes(150000):strip_icc():format(webp)/Screenshot2025-04-23at8.28.00AM-9ac025ce80184ad898ec7ff5454b2522.png)