Monthly Archives: November 2024

Market Fundamental Analysis

Price-to-Earnings (P/E) Ratio

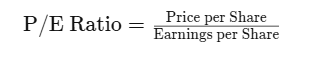
PE ratio is the ratio of a company’s stock price to its earnings per share. Value investors commonly use it as one way to measure if a company is undervalued.

Calculating the P/E Ratio

To calculate a company’s P/E ratio, we use the following formula:

COMPANY
(Sample data)
STOCK PRICE
(P/S)
Diluted EARNINGS PER SHARE (EPS)PRICE-to-EARNINGS (P/E) Ratio
Company AA106.946.31106.94/6.31 = 16.95
Company BA150.919.76150.91/9.76 = 15.46
Company CA79.953.7179.95/3.71 = 21.55
Company DA178.357.54178.35/7.54 = 23.66

EARNINGS PER SHARE (EPS):

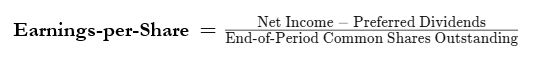
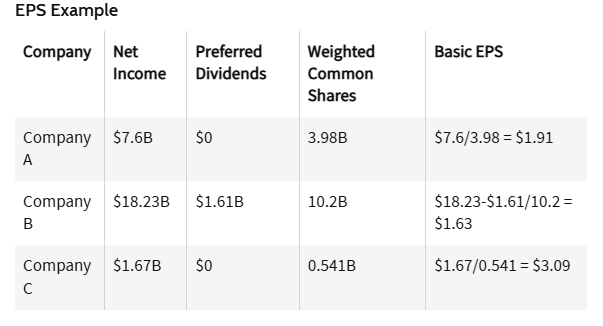
Earnings per share (EPS) is a company’s net income subtracted by preferred dividends and then divided by the number of common shares it has outstanding.

Calculating Earnings per Share:

Forward Price-to-Earnings (Forward P/E)

Forward price-to-earnings (forward P/E) is a version of the ratio of price-to-earnings (P/E) that uses forecasted earnings to calculate the ratio.

Calculating Forward P/E Ratio:

For example, assume a company has a current share price of $50 and this year’s earnings per share (EPS) are $5. Analysts estimate that the company’s earnings will grow by 10% over the next fiscal year. The company has a current P/E ratio of:

The forward P/E, on the other hand, would be $50 / (5 x 1.10) = 9.1x. Note that the forward P/E is smaller than the current P/E since the forward P/E accounts for future earnings growth relative to today’s share price.

Trailing Price-To-Earnings (Trailing P/E)

Trailing price-to-earnings (P/E) is a relative valuation multiple that is based on the last 12 months of actual earnings. It is calculated by taking the current stock price and dividing it by the trailing earnings per share (EPS) for the past 12 months.

Trailing P/E can be contrasted with the forward P/E, which instead uses projected future earnings to calculate the price-to-earnings ratio.

Calculating Trailing P/E Ratio:

Trailing P/E Ratio = Current Share Price / Trailing 12-Month EPS

Example of Trailing Price-To-Earnings

For example, a company with a stock price of $50 and 12 month trailing EPS of $2, thus has a trailing P/E ratio of 25x (read 25 times). This means that the company’s stock is trading at 25x its trailing 12 month earnings.

Using the same example, if the company’s stock price falls to $40 midway through the year, the new P/E ratio is 20x, which means the stock’s price is now trading at only 20x its earnings. Earnings have not changed, but the stock’s price has dropped.

Company
(Sample data)
Current Share Price (P/S)Est. Future EPS
(12 months)
Forward P/ETrailing EPS
(12 months)
Trailing P/E
(x is read x times)
Company AAS505 X 10%50 / (5 x 1.10) = 9.1250 / 2 = 25x
Company ABS 656.5 X 20%65 / (6.5 x 1.20) = 8.33 465 / 4 = 16.25x
Company ACS2053.5 X 30%205 / (3.5 x 1.30) = 45.064205 / 4 = 51.25x

How to Calculate PEG Ratio for a Stock?

What Is a Good PEG Ratio for a Stock?

The price/earnings-to-growth ratio, or PEG ratio, divides a company’s price-to-earnings (P/E) ratio by its earnings growth rate over a specific period. It strengthens the P/E ratio by taking into consideration the growth rate of earnings.

The PEG ratio is a stock valuation measure that investors and analysts can use to get a broad assessment of a company’s performance and to evaluate investment risk.

In theory, a PEG ratio value of 1 represents a perfect correlation between the company’s market value and its projected earnings growth. PEG ratios higher than 1.0 are generally considered unfavorable, suggesting a stock is overvalued. Conversely, ratios lower than 1.0 are considered better, indicating a stock is undervalued.

Key Takeaways

  • The price/earnings-to-growth, or PEG ratio is a valuation metric used for stocks.
  • PEG builds on the P/E ratio by considering expected earnings growth and not just current earnings.
  • A PEG ratio of under 1.0 can indicate a stock is undervalued and a potential buy.
  • A PEG above 1.0 can indicate an overvalued stock.
  • The PEG will vary based on earnings growth forecasts and the time frame being considered.

Calculating the PEG Ratio

To calculate a stock’s PEG ratio you must first figure out its P/E ratio. The P/E ratio is calculated by dividing the per-share market value by its per-share earnings. From here, the formula for the PEG ratio is simple:

Example of the PEG Ratio

If you’re choosing between two stocks from companies in the same industry, then you may want to look at their PEG ratios to make your decision. For example, the stock of Company Y may trade for a price that’s 15 times its earnings, while Company Z’s stock may trade for 18 times its earnings. If you simply look at the P/E ratio, then Company Y may seem like the more appealing option.

However, Company Y has a projected five-year earnings growth rate of 12% per year while Company Z’s earnings have a projected growth rate of 19% per year for the same period. Here’s what their PEG ratio calculations would look like:

Company Y PEG = 15/12% = 1.25

Company Z PEG = 18/19% = 0.95​

This shows that when you take possible growth into account, Company Z could be the better option because it’s actually trading for a discount compared to its value.

What Is MACD in Investment Market?

Moving average convergence/divergence (MACD) is a technical indicator to help investors identify price trends, measure trend momentum, and identify entry points for buying or selling. Moving average convergence/divergence (MACD) is a trend-following momentum indicator that shows the relationship between two exponential moving averages (EMAs) of a security’s price. MACD was developed in the 1970s by Gerald Appel, and is one of the most popular technical tools, readily available on most trading platforms offered by online stock brokers.

Key Takeaways

  • Moving average convergence/divergence (MACD) is a technical indicator to help investors identify entry points for buying or selling.
  • The MACD line is calculated by subtracting the 26-period exponential moving average (EMA) from the 12-period EMA.
  • The signal line is a nine-period EMA of the MACD line.
  • MACD is best used with daily periods, where the traditional settings of 26/12/9 days is the default.

MACD Formula

MACD is calculated by subtracting the long-term EMA (26 periods) from the short-term EMA (12 periods). An EMA is a moving average (MA) that places a greater weight and significance on the most recent data points.

Using MACD

MACD has a positive value (shown as the blue line on the MACD chart) whenever the 12-period EMA (indicated by the red line on the price chart) is above the 26-period EMA (the blue line in the price chart), and a negative value when the 12-period EMA is below the 26-period EMA. The distance between MACD and its baseline depends on the distance between the two EMAs.